The Detection Funnel: How Your 80% ATT&CK Coverage Becomes a 6% Catch Rate
ATT&CK coverage % looks good in board decks. Here's why it compounds into a ~6% actual catch rate, and what Threat Detection Coverage actually means.
Here is a number most detection programs never compute: their actual catch rate.
Not “what percentage of ATT&CK techniques have detections in our SIEM.” Not “how many alerts fired last month.” The actual catch rate: of every adversary technique active in your environment right now, what percentage does your SOC successfully detect, investigate, and act on?
For most organizations, it is around 6%.
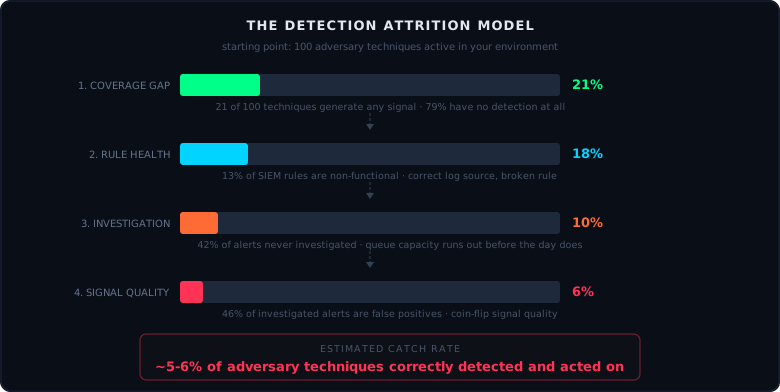
That number comes from multiplying four independent industry statistics together, each measuring a different stage of detection attrition. This post builds that model, explains why its most important input is already wrong, and describes what a detection program dashboard should actually track.
The Four Stages of Detection Attrition
A threat has to survive four filters before your SOC acts on it. Most discussions treat these as separate problems. They are not. They compound.
Stage 1: The Coverage Gap
Enterprise SIEMs have detection coverage for 21% of adversary techniques defined in the MITRE ATT&CK framework. The remaining 79% generate no alert whatsoever if used against you [1].
This is not a capability gap. The same research found that SIEMs have enough telemetry to detect over 90% of ATT&CK techniques [1]. The gap is between what can be detected and what has actually been built, enabled, and connected to a working log source.
After Stage 1: 21 of every 100 adversary techniques generate any signal.
Stage 2: Rule Health
Of the 21 techniques that have detection coverage, not all of them actually fire. CardinalOps found that 13% of SIEM rules are non-functional [1]: present in the library, counted in coverage reports, but guaranteed to never trigger. The causes are predictable: misconfigured data sources, missing log fields, broken field parsers, log sources that were decommissioned without anyone updating the rule inventory. The Blue Report 2025 found that 50% of detection rule failures trace back to log collection problems alone [2].
The operational reality: your coverage percentage on paper is higher than your effective coverage. The 21% is already an optimistic input.
After Stage 2: ~18 of the original 100 techniques generate a real alert.
Stage 3: The Investigation Gap
The 18 alerts that do fire do not all get investigated. The SANS 2025 SOC Survey found 40% of alerts are never investigated in traditional SOC setups [3]. The AI SOC Market Landscape 2025 puts it at 42% [4]. At an average of 2,992 alerts per day [5], with finite analysts on finite shifts, this is a capacity constraint, not negligence. Teams make explicit or implicit priority calls, and a significant portion of the queue gets cleared without a human ever opening it.
This stage is changing. AI-assisted triage is reducing the uninvestigated backlog, which is real progress. But it is also introducing a failure mode the original capacity problem did not have: AI false closure. An alert that goes uninvestigated sits visibly in a queue. An alert that gets incorrectly closed by an AI agent has a paper trail showing it was handled. It does not look like a gap. That distinction matters when you are trying to audit what you missed.
Both sub-problems belong in Stage 3: alerts not looked at, and alerts looked at wrong.
After Stage 3: ~10-11 of the original 100 techniques get investigated correctly.
Stage 4: Signal Quality
Of the 10-11 alerts that do get investigated, nearly half are false positives. The Microsoft/Omdia State of the SOC 2026 report found 46% of all alerts prove to be false positives [6]. When an analyst opens an alert, there is roughly a coin-flip chance they are about to spend investigative time on a dead end.
After Stage 4: ~5-6 of the original 100 techniques are correctly identified and acted on.
The Model
100 adversary techniques active in your environment

  × 0.21  ATT&CK coverage (79% of techniques have no detection)
  = 21 can generate any signal

  × 0.87  rule health (13% of rules are non-functional)
  = ~18 actually fire

  × 0.58  investigation rate (42% never investigated or incorrectly closed)
  = ~10 get real analyst attention

  × 0.54  signal quality (46% are false positives)
  = ~5-6 correctly identified and acted on

Estimated catch rate: 5-6%
These are industry aggregates, not your organization’s specific numbers. Your actual catch rate may be higher or lower depending on program maturity, investment level, and how honest your telemetry inventory is. The model’s value is not the specific output. It is the structure. Each stage has a different fix, a different cost, and a different timeline. The model makes that visible.
The Problem: Detection Coverage Is a False Metric
Here is the part that most detection program conversations skip: the 21% in Stage 1 is itself wrong before we even start compounding it.
ATT&CK coverage percentage measures framework completion. It counts how many techniques have a rule in your SIEM. It does not measure whether that rule actually works for your environment, for your assets, against threats that target organizations like yours.
Specifically, it does not account for:
Signal quality. A detection that covers T1078 (Valid Accounts) is meaningless if your identity provider is not actually sending events to your SIEM. The rule exists. The signal does not. Your coverage report shows green. Your actual exposure is unchanged.
Entity coverage. Not all assets are instrumented. A detection for cloud lateral movement will not fire on the workloads that do not have logging enabled or forwarded. The technique is “covered” in your framework report and completely invisible in practice.
Allowlist and suppression erosion. Every exception you add to reduce false positives also reduces recall. A rule with dozens of suppression conditions might be blind to a significant portion of the technique it claims to cover. This tradeoff is almost never tracked.
Detection drift. Rules written 18 months ago may not match today’s log schema, infrastructure changes, or updated attacker tradecraft. They are in your coverage percentage. They are not covering anything.
The result: an organization reporting 80% ATT&CK coverage could have effective signal coverage well below that. Which means Stage 1 of the funnel is already being fed a number that overstates the reality.
What to Measure Instead: Threat Detection Coverage
The metric that replaces ATT&CK coverage percentage is Threat Detection Coverage, a composite that measures your detection program end to end: signal fidelity, rule health, detection logic, investigation outcomes, and response.
The critical difference is the denominator. ATT&CK coverage uses “all framework techniques” as the baseline. Threat Detection Coverage uses your specific threat model: the threat actors, techniques, and attack paths relevant to your industry, your stack, and your highest-value assets.
A detection program with 30% ATT&CK coverage but 90% coverage of its top 10 threat scenarios is in a materially better position than one with 80% ATT&CK coverage distributed across techniques no relevant adversary uses against organizations like yours.
Getting to Threat Detection Coverage as a real metric requires aligning three things:
Assets: What are you protecting? What surfaces exist: endpoint, cloud, identity, SaaS? What is actually instrumented and sending signal?
Threat model: What adversaries and techniques are actually relevant to you? This is not the full ATT&CK matrix. It is a prioritized, maintained view of what you are most likely to be targeted with.
Coverage pipeline: For each technique in your threat model, do you have a working, tested detection with healthy signal that fires reliably and gets investigated when it does?
The gaps between these three are your actual risk. Not your gap to full ATT&CK coverage.
The Four Metrics That Belong on a Detection Program Dashboard
1. Threat coverage per surface
Not a global ATT&CK percentage. Coverage scoped to your asset map and threat model, broken out by major surface: endpoint, cloud, identity, SaaS. For each surface, what percentage of the threat scenarios relevant to that surface have working, tested detections?
This forces two things your current coverage report probably does not: a maintained threat model, and a mapping of detections to that model rather than to the full framework.
2. Alert disposition metrics
For every alert category: what proportion are auto-closed, analyst-investigated, and escalated to incidents? Track the ratio over time, not as a snapshot.
A category where 95% of alerts are auto-closed and almost none escalate is either very well-tuned or completely blind. You need end-to-end testing data (metric 4) to tell the difference. A category where 60% of alerts escalate to incidents but analyst time-to-triage is high is a capacity problem, not a tuning problem.
3. Recall and Precision
These are the correct signal quality metrics for a detection program:
-
Precision: of the alerts that fire, what percentage represent real threats? This is 1 minus your false positive rate. You probably already track something like this, even informally.
-
Recall: of the real threats that occurred, what percentage did you detect? This requires purple team exercises, adversary simulation, or red team engagements to generate ground truth. Without it, you have no idea whether your detections are working or whether adversaries are simply not using the techniques you cover.
High recall and low precision is alert fatigue. High precision and low recall is false confidence. Both metrics are needed. Most programs track neither rigorously.
4. End-to-end testing metrics
Tested coverage, not theoretical coverage. Run atomic tests and adversary simulations against your environment. Measure whether the expected alert fired, whether it was triaged correctly (including by AI triage), and whether response happened within your defined SLA.
A detection that fires in a test but gets closed incorrectly at triage is not working. The end-to-end test is the only thing that tells you where the pipeline actually breaks.
Tune the Model to Your Program
The funnel percentages in this post are industry aggregates. They are starting assumptions: the best available proxy before you have internal data. As you build out the four metrics above, replace them:
Stage 1 input: your actual threat coverage per surface (not ATT&CK %)
Stage 2 input: your rule validation pass rate from automated health checks
Stage 3 input: (alerts investigated correctly) / (total alerts fired)
              where "correctly" includes AI triage accuracy from E2E tests
Stage 4 input: your precision rate (1 - FP rate) by alert category
The output changes from an industry estimate to a program-specific number. More importantly, the stage-by-stage breakdown shows you where your program’s specific drag is, which is the conversation worth having with leadership, not the aggregate catch rate.
What This Does Not Tell You
The funnel is a program health model, not a risk model. A 6% catch rate does not mean you are at 94% risk of breach. Most adversary activity in any environment during a given period is opportunistic, automated, and stopped by preventive controls before a detection is needed.
What the funnel tells you is whether your detection program is doing the job it is supposed to do: catching what gets past those preventive controls. The 6% number is an argument for investing in detection program fundamentals, not a prediction of breach probability.
Closing
Detection coverage percentage is a metric that is easy to report and hard to interpret. It measures framework completion, not program effectiveness. It gives leadership a number that looks like signal but is mostly noise.
The argument this post makes is not that detection programs are broken. It is that the way most programs measure themselves makes it impossible to tell whether they are broken or not.
Threat Detection Coverage (built on signal fidelity, rule health, tested recall, and asset-anchored threat modeling) gives you a measurement framework that is harder to build but actually tells you something. The four metrics above are where to start.
Use the 6% in the first slide. Then explain what needs to change for that number to mean something.
Resources
- 2025 State of SIEM Detection Risk Report. CardinalOps, June 2025 (SIEMs detect 21% of ATT&CK techniques though ~90% are coverable; 13% of rules non-functional).
- The Blue Report 2025. Picus Security (50% of detection-rule failures trace to log-collection problems).
- SANS 2025 SOC Survey. SANS Institute (~40% of alerts never investigated).
- The AI SOC Market Landscape 2025. Software Analyst Cyber Research (42% of alerts never investigated; ~960 alerts/day baseline).
- 2026 State of Threat Detection and Response. Vectra AI (average 2,992 alerts per day).
- State of the SOC 2026. Microsoft / Omdia (46% of all alerts prove to be false positives).